
Machine Learning: Fantasy Football Projections
Introduction
Fantasy football has become extremely popular over the last 10 years. The Fantasy Sports and Gaming Association estimated that there were 36 million fantasy football participants in the United States in 2019. Of those participants, roughly 80% spent money in some way to play. According to FOX Business, in 2018 the average player spent $556 in league-related costs.
This means that players are trying to find any advantage that they can to get a leg up on their competition.
There are many different sources out there that provide in-depth fantasy football analysis to players. Some are available publicly and others require a paid subscription. With the surge in popularity, this has become a business in itself.
I’ve always been fascinated with the projections that these sources put out there. Finally, after a few years of wondering whose projections are reliable, what goes into these numbers, and if it’s really worth spending my money on, I decided to begin building my own algorithm for fantasy football projections.
By the end of this, I will show you the basic building blocks to building a fantasy football projection algorithm of your own.
Analytical Framework
The idea at question here is: Can we use past NFL statistics to accurately predict how a player will perform in the upcoming NFL season (particularly as it relates to fantasy football)?
Organizing the Data
The data that I used for this project came from Pro Football Focus (pff.com). They have different levels of data available based on levels of membership. I am an “Edge” member, so I used all of the data that is available at that membership tier. Their website makes it very easy to download csv data files.
This project only includes FLEX players. A FLEX player is defined as a running back, wide receiver, or tight end.
I filtered the data to include only players who played at least 4 games in a given season and were on the field for at least 25% of the snaps in the games that they appeared in. I did this to get rid of extremely low sample size guys (since these are not players we would be drafting anyways).
Based on that criteria, I used all available data from the 2010 season through the 2019 season. For fantasy football points, PPR (point per reception) scoring rules were used in the analysis.
All analysis was done using R.
The available features in the dataset that were considered in the analysis are:
- Games played
- Targets
- Receptions
- Receptions of 40+ yards
- Receiving yards
- Games with 100+ receiving yards
- Receiving TDs
- Receiving TDs of 40+ yards
- Drops
- Catch %
- Average depth of target
- Yards per target
- Yards per reception
- Yards after catch
- Carries
- Carries of 40+ yards
- Rushing yards
- Games with 100+ rushing yards
- Rushing TDs
- Rushing TDs of 40+ yards
- Yards per carry
- Yards after contact
- Tackles avoided
- Tackles avoided per attempt
- Fumbles
- Touches (engineered from existing variables)
- Fantasy points
- Fantasy points per snap
- Fantasy points per touch
- Fantasy points per game (engineered from existing variables)
- Last season fantasy points (engineered from existing variables)
- Last season fantasy points per game (engineered from existing variables)
The dependent variable that was used to train the model is:
- Next season fantasy points per game (engineered from existing variables)
Building the Model
The objective is to predict a player’s fantasy points per game for the next season and then multiply that by 16 (NFL has a 16-game season) to produce a season points total projection.
Because running back, wide receiver, and tight end are three very different positions, I subset the data by position and built a unique machine learning model for each. The following process outlines the methodology used to build each model.
The data used to build the model was from 2010 – 2018. Data from the 2019 season was not included since a “Next season points per game” variable cannot be engineered as the dependent variable (this is ultimately what we want to predict).
This data was then randomly split into a training and test set, with 75% of the data being in the training set and 25% being in the test set. The running backs training set included 184 player seasons, wide receivers included 301 player seasons, and tight ends included 189 player seasons.
Next, I used Recursive Feature Elimination via the caret package on the training set to decide on which features to include in building the model. For running backs the top predictors were fantasy points per game, rushing yards, and carries. For wide receivers the top predictors were fantasy points per game, targets, and receiving yards. For tight ends the top predictors were fantasy points per game, fantasy points per snap, and receptions.
Using the selected features, I built a random forest model, a linear regression model, a k-nearest neighbor model, and a neural network and compared performance across them all to select a final model.
Results
The final models and their performance are as follows:
- Running backs: k-nearest neighbor model with an R-squared of 0.55 and an RMSE of 4.19 points.
- Wide receivers: linear regression model with an R-squared of 0.54 and an RMSE of 3.64 points.
- Tight ends: random forest model with an R-squared of 0.57 and an RMSE of 2.79 points.
Considering the small training set size for each model, I was pleased with the performances.
The final models were then used to predict 2020 fantasy points with the 2019 data which was previously excluded from training/testing.
Below is how the distribution of 2020 predicted fantasy points compares to the distribution in 2019.
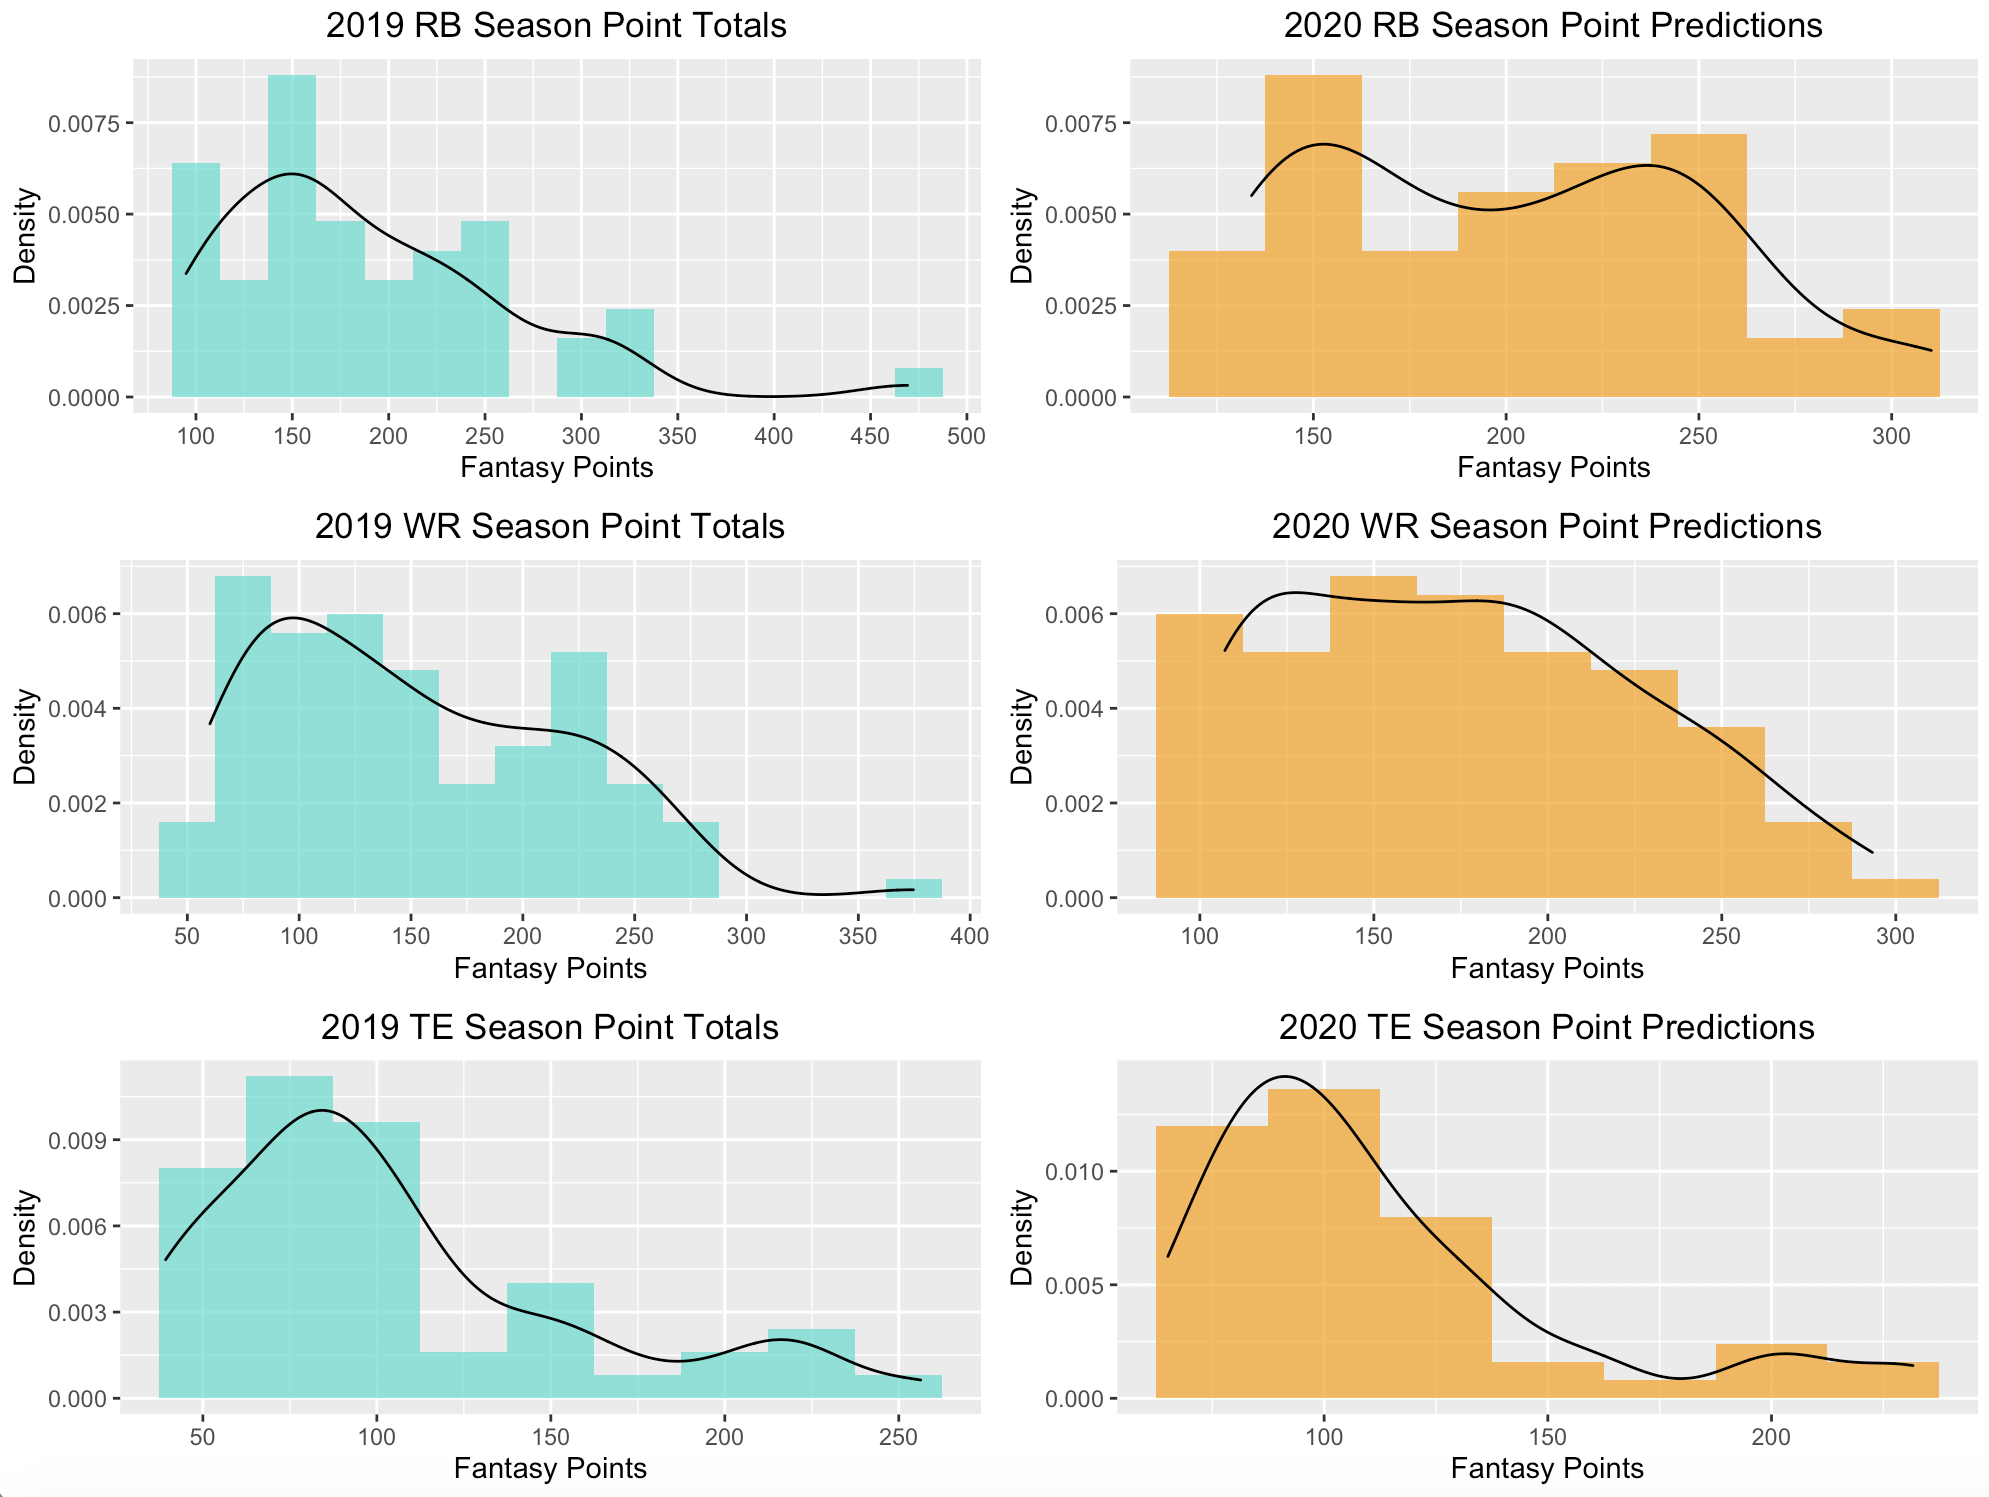
With exception to a couple of 2019 running back and wide receiver outliers, the distributions from 2019 to 2020 look similar.
Click below for the predicted 2020 fantasy football power rankings across all positions.
2020 Fantasy Football Projection Rankings
Using k-means clustering, I clustered the predicted results into “tiers.” I have always liked this approach of drafting because its more flexible. Every machine learning model has some error involved when predicting, so rather than strictly drafting down an ordered list, this is a good way of identifying groups of players that the model has predicted to perform similarly.
Click below for the predicted 2020 fantasy football tiers across all positions.
2020 Fantasy Football Projection Tiers
Future Improvements
This is a very simple model and there are some obvious short comings that can be improved upon.
The first is that it assumes that every player will play all 16 games next season. This becomes an issue with injury prone players and players that we know are not starting on the depth chart. In the future it could be worth looking into a separate model attempting to predict number of games that will be played next season and then combining the two outputs to calculate next season’s total points.
Another is that the model doesn’t know about any past injuries. Some data in the dataset might be misleading if a player had been injured that season. Adding into the model a binary injury flag for each season could improve performance.
Also, having more personal data for each player could improve performance. Such things like age, seasons in the league, pro bowls, contract info, etc. could help the model. For the scope of this project I was just using the data available in the Pro Football Focus dataset, but this is data that could be found from other sources and included.
Next Steps
Besides continuing on the improvements mentioned above, the next step will be to build a similar model for quarterbacks. Once I can predict 2020 fantasy football points for quarterbacks, then I can include them in the ranking and tier worksheets and have complete 2020 fantasy football draft cheat sheets.